The price indices for February 2014 have been calculated.
All the main indices show deflation in February 2014, except the Mineral Price Index, which shows a 2.6% inflation. In January, by contrast, the inflation in the Mineral Price Index was 4.2%. This blog takes a look at mineral trade in the wake of (and during) the battle of B-R5RB.
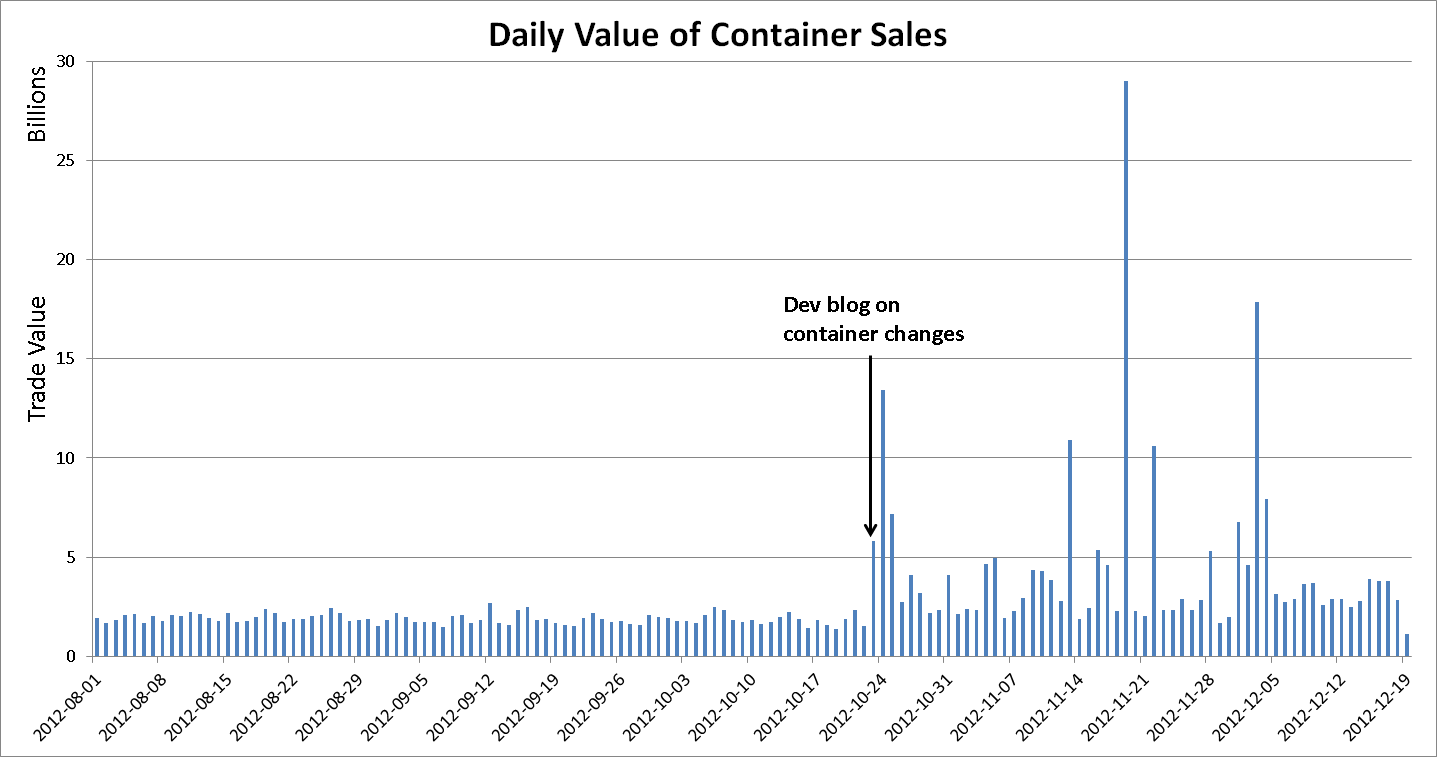
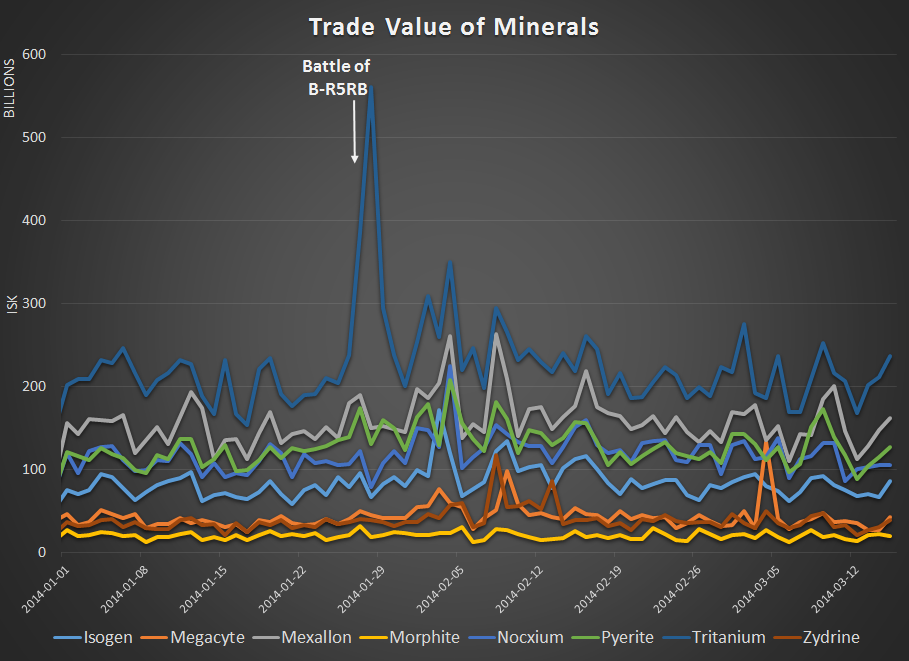
Looking at the total value of traded minerals in the graph below, it is apparent that the mineral market was noticeably affected on the day of the battle of B-R5RB. A shift in level is shown by separating the series and drawing linear trend lines through them before and after the battle. The series before the battle is quite stable, whereas the series after jumps significantly but then starts to trend down towards the previous level.

A look at the trade value for each of the minerals in the graph below shows that the biggest effect by far was on Tritanium. The main spike in the trade of Tritanium comes on January 27 and January 28, the days of the battle, but then dies down. A second, smaller spike happens at the beginning of February and affects all minerals except for Morphite. This second spike then fades slowly.
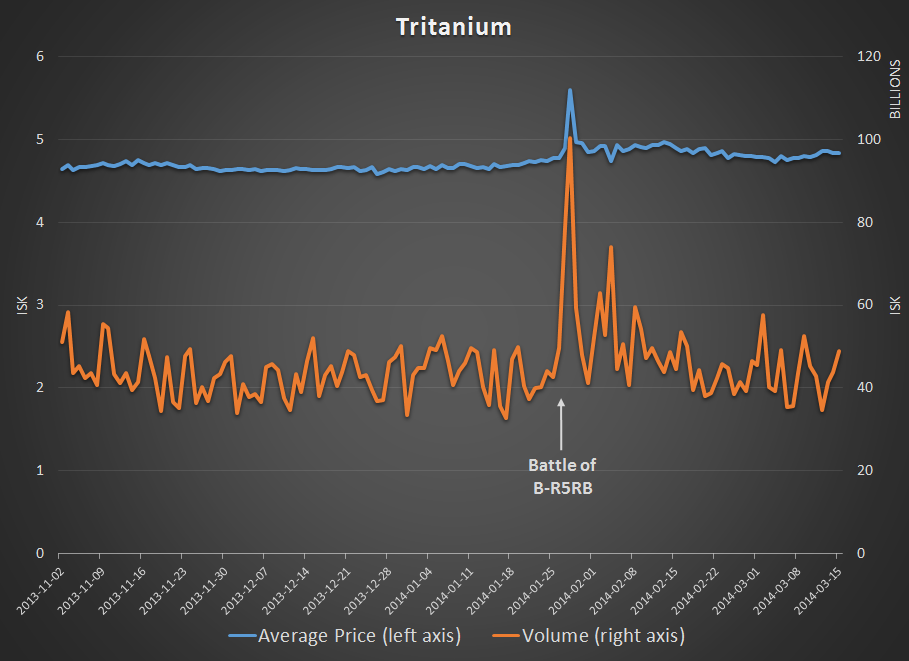
Taking a closer look at Tritanium, the graph below shows the effect on the daily average price and traded volume. Over the seven days before the battle, the average price of Tritanium was 4.75 ISK, while traded quantity averaged 42 billion units.
On January 28, the second day of battle, the price had risen by 18% to 5.59 ISK, and daily traded quantity jumped by 138%. The week after the battle, the price subsided to 4.89 ISK, only 3% above what it was the week before battle; traded quantity, however, was still 32% higher.
This sudden and short-lived effect on Tritanium warrants a closer look.
The following figure graphs the hourly trade value of Tritanium on the two days of the battle of B-R5RB (blue line) and compares is to the same days the week before (orange line). Additionally, the columns show the number of Titans destroyed (right axis) each hour on the two days of the battle.
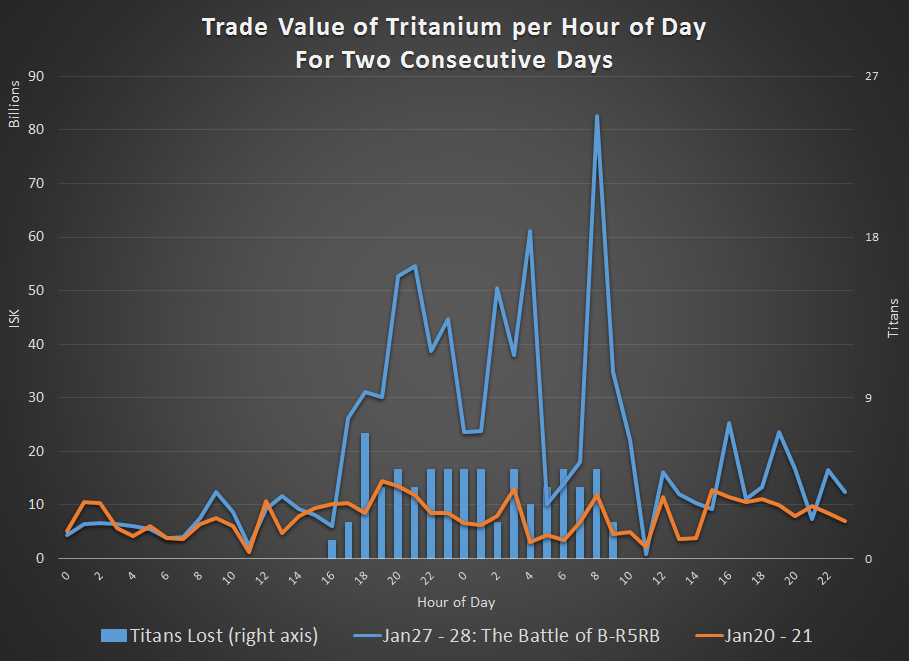
No real changes happen after the first Titan falls, but in the second hour of battle, when two more Titans go down, the market reacts and the trade value rises sharply. It then follows the ”Titan death count“ pretty well and ends with one last spike. After that the market calms down.

Looking at the long-term trend in mineral trade value shows that the market has resumed the level it was at before the battle, although day to day fluctuations are perhaps slightly larger than before.
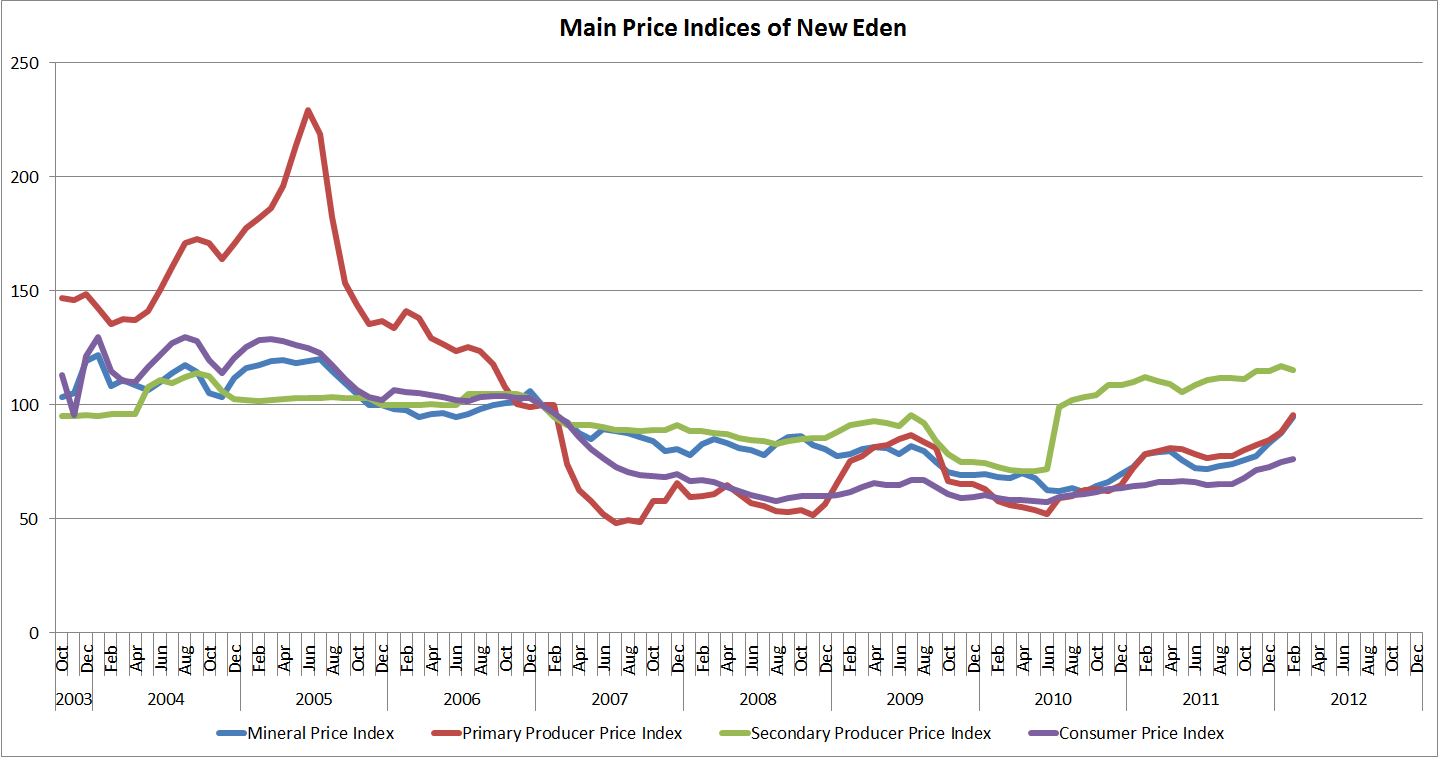
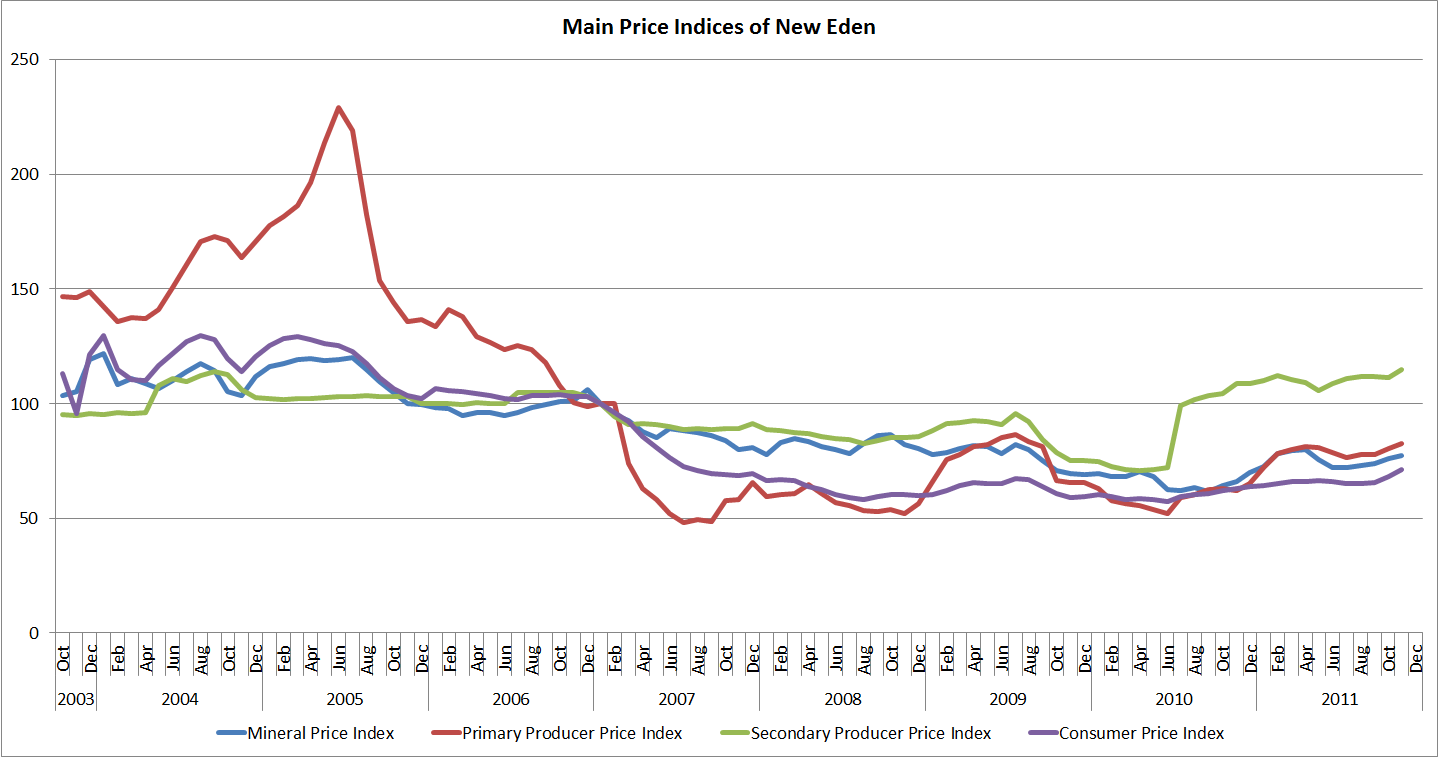
In other news, all the other main price indices showed deflation in February. The Primary Producer Price Index dropped by 5.3%, which was mostly driven by moon materials and hybrid polymers. The Secondary Producer Price Index fell by 3.5%, where the biggest contributors where planetary commodities, salvage and Tech II construction components. Finally, the Consumer Price Index showed a deflation of 0.6%, with most categories showing a mild deflation. There were two main exceptions to the deflation in the CPI.
One was PLEX prices, which rose by only 1% but weighed a whopping 24% in the index. The other was Tech I ship prices, which rose by 3.8% due to the effect the battle of B-R5RB had on mineral prices.
The index values for February are:
|
|
February 2014 |
1 Month Change |
12 Month Change |
|
Mineral Price Index |
114.3 |
2.6% |
-12.0% |
|
Primary Producer Price Index |
72.2 |
-5.3% |
-18.6% |
|
Secondary Producer Price Index |
98.4 |
-3.5% |
-17.7% |
|
Consumer Price Index |
78.5 |
-0.6% |
-4.7% |
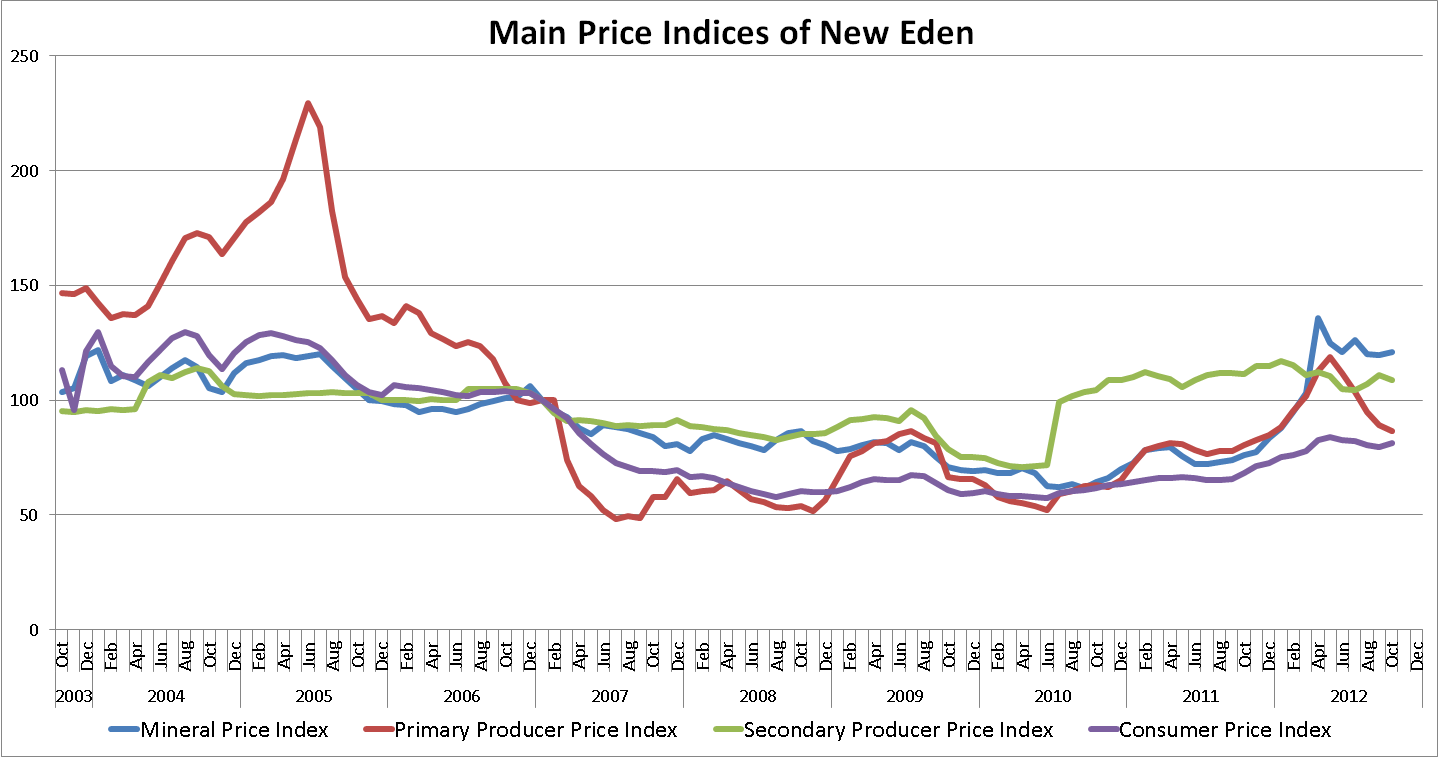
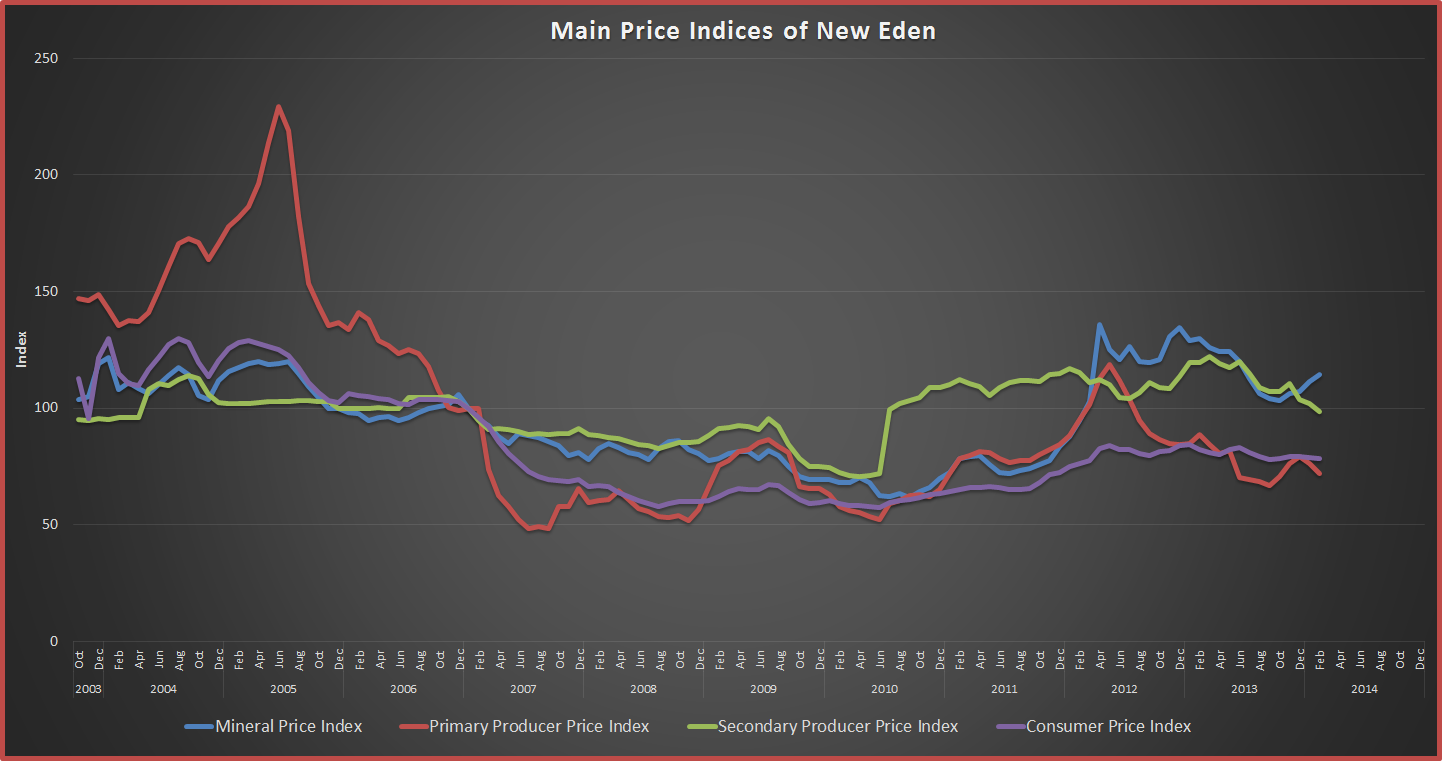
The following graph shows the development of the indices since October 2003.
The battle of B-R5RB clearly illustrated the massive scope of EVE Online, and was probably the biggest PvP battle in gaming history. This caught the attention of the media, which emphasized the size of it all, the organization of thousands of people all over the planet, the time commitment, the intelligence work, the planning, and the incredible real world value of the virtual ships lost.
But what the battle also showed is how ruthlessly efficient the EVE market is, even when dealing with such shocks to the system.
New to EVE? Start your 14-day free trial today.
Returning pilot? Visit Account Management for the latest offers and promotions.