All posts by CCP Quant

Insights into 2013 production and destruction

Alternate title: EVE Online Graph porn of 2013. 

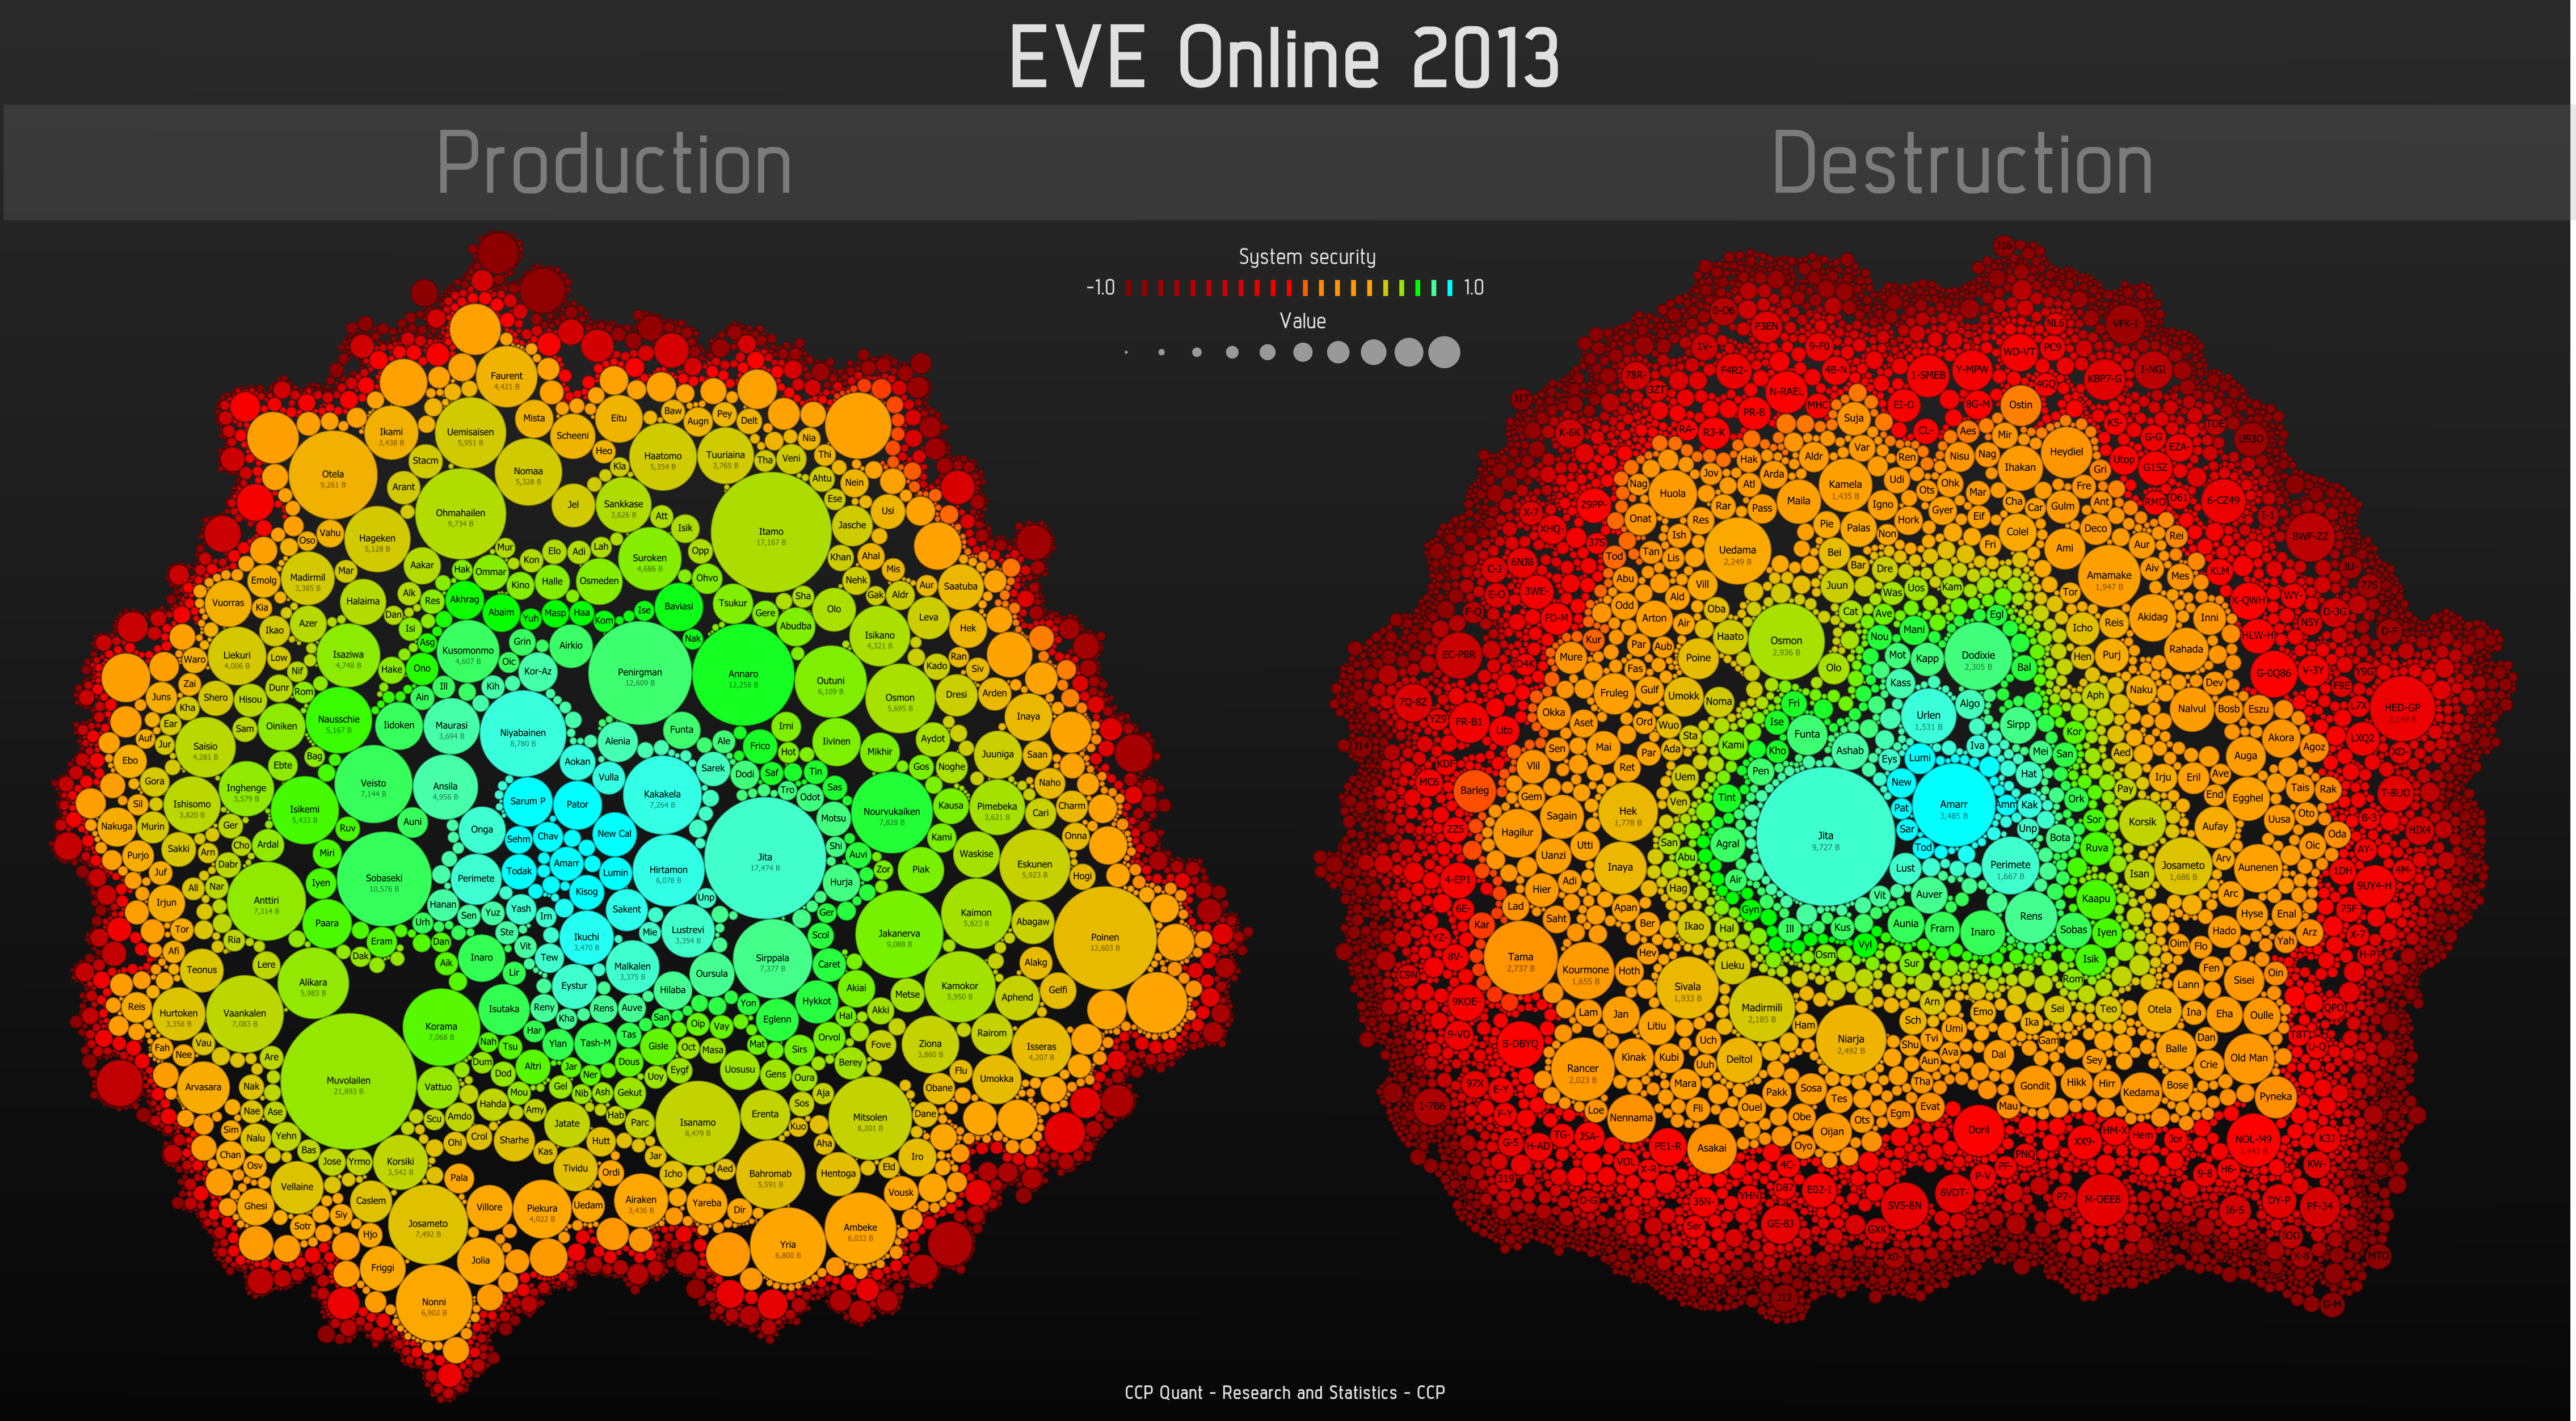
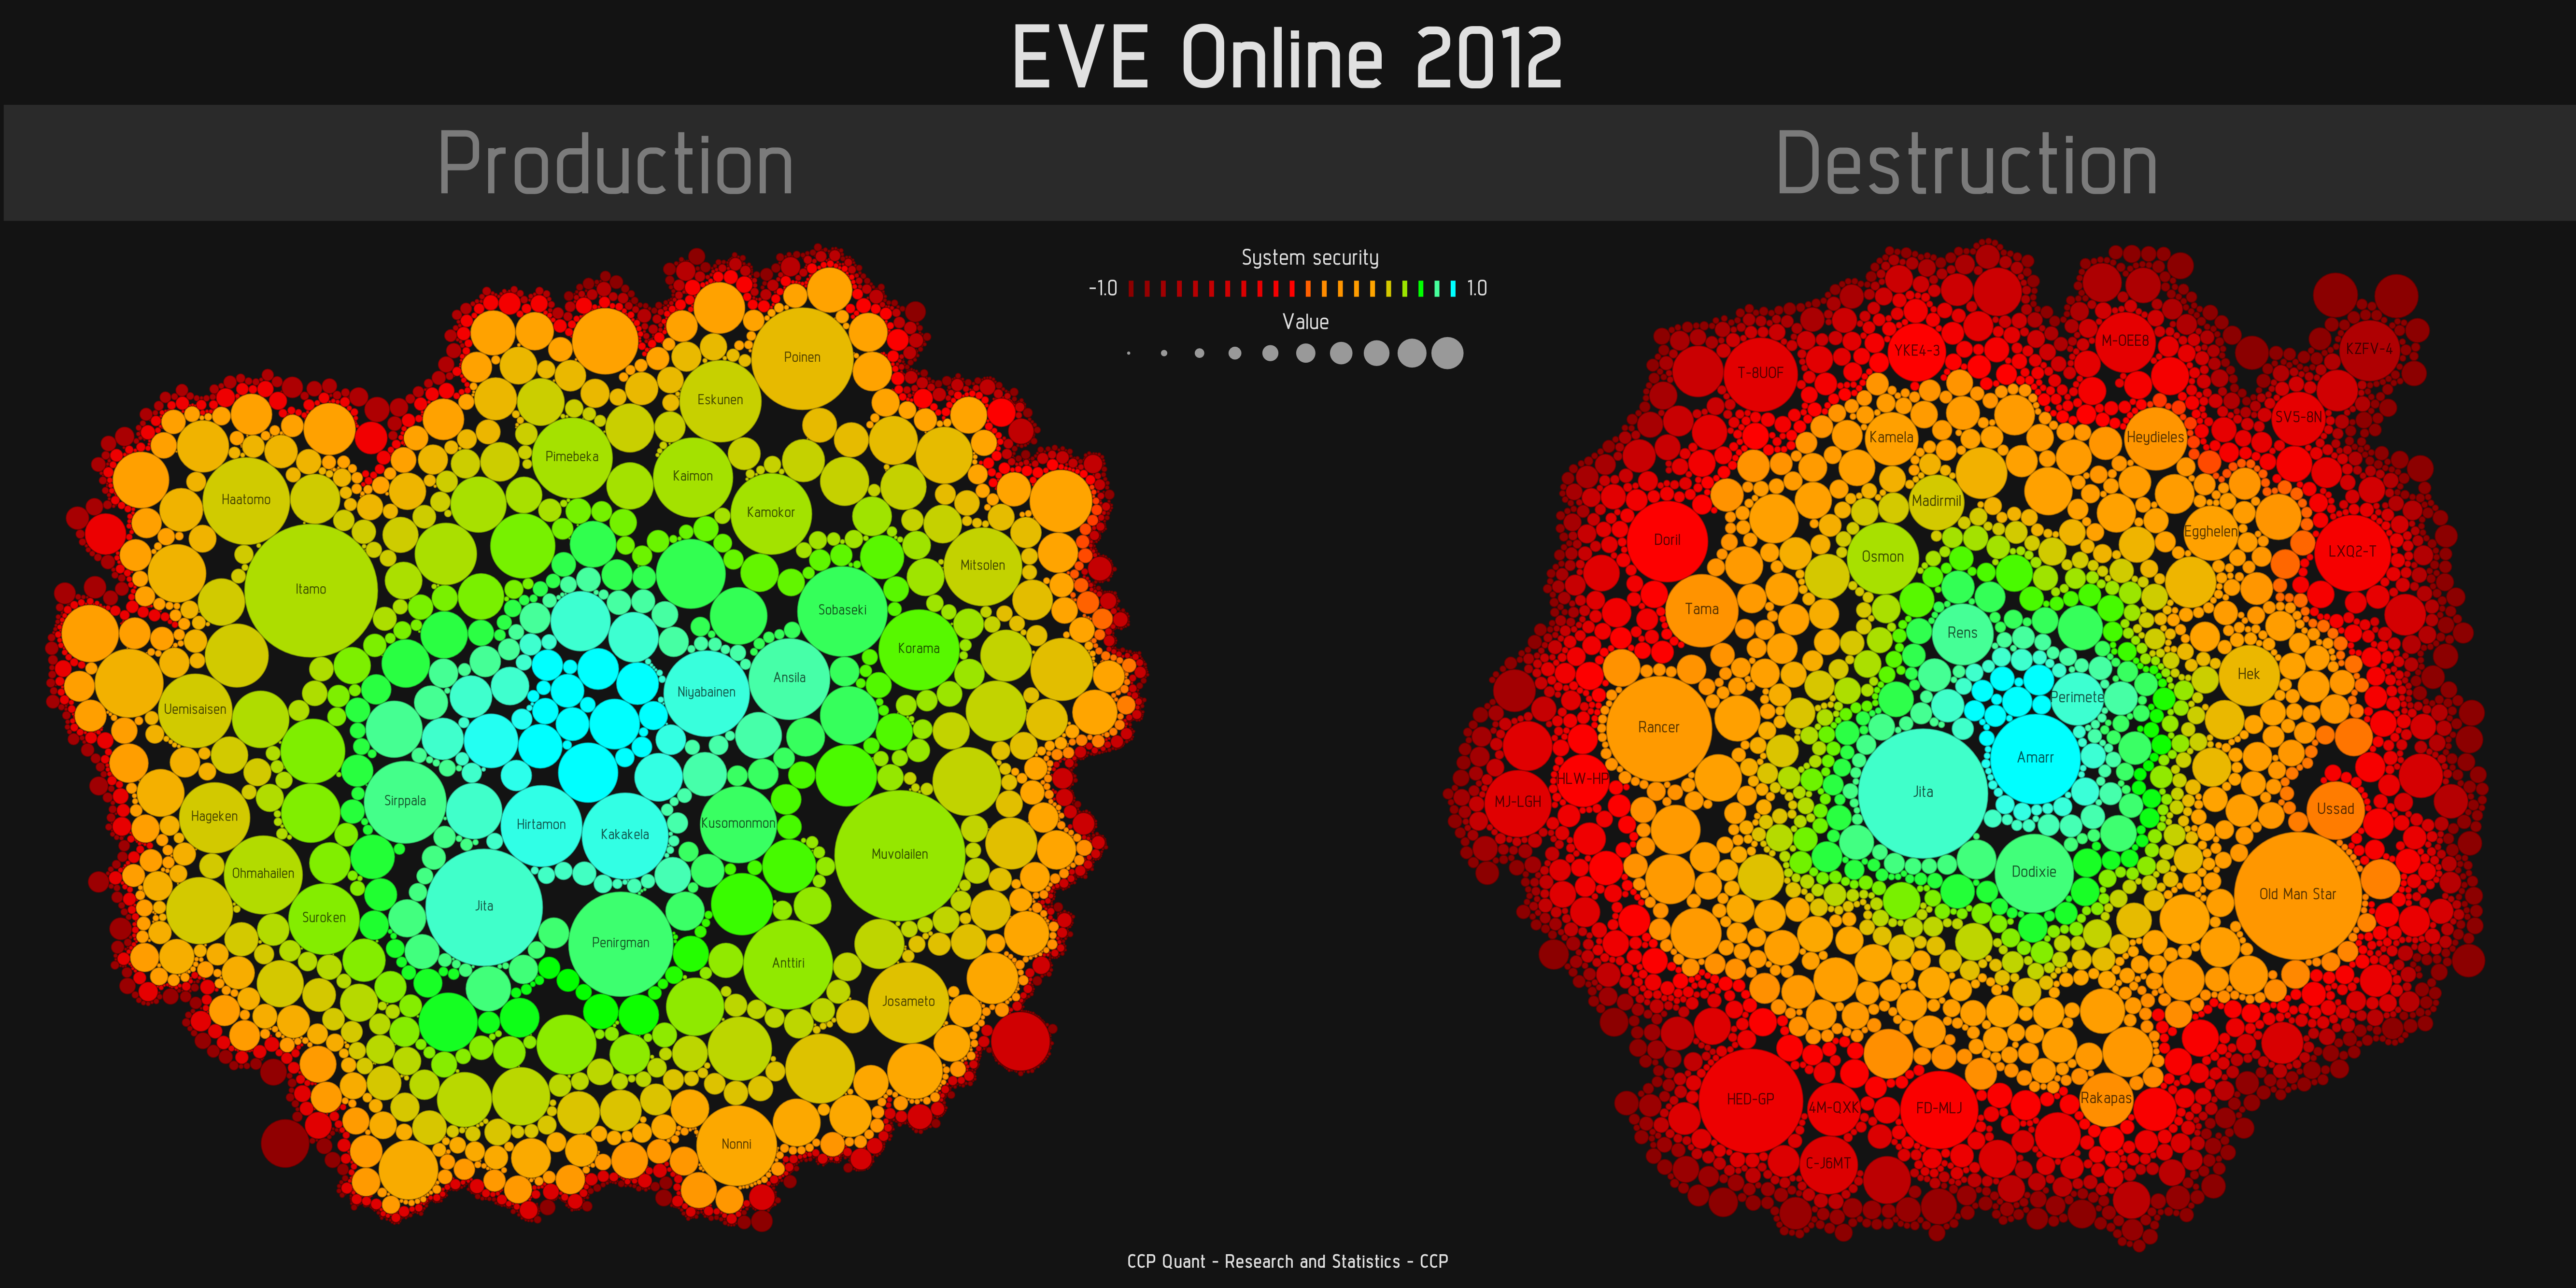
Last year, for the presentation on the EVE Economy at Fanfest, I made a graph titled "EVE Online 2012: Production vs. Destruction" (400dpi version). A Redditor named SurteaD sent me a message about a month ago asking if the players might see a 2013 version of that graph. I personally was interested in seeing it myself and since it's procedurally generated with d3.js from a database query, I figured it wouldn't take me long to "refresh" them.  So, without further ado, I present to you EVE Online 2013: Production vs. Destruction:


(click image for a larger version)

For those few of you reading this that don't know much about EVE Online, here is a short description at what you are looking at
In the EVE Online universe, war is an ongoing machine that is fueled by production. Most wars take place in the outermost regions of space (red on the scale), far beyond the safety of the high security regions of the Empires (light blue on the scale). The most favorable conditions for production are a mix of close proximity to major market hubs and the safety provided by the high security regions surrounding them. This visualization tells this story, showing the total produced- and destroyed-value of end products (ships and modules), where production mainly takes place in higher-security space (yellow to blue) and the majority of destruction takes place in low- or null-security space (orange to red).

A few important things I'd like to note:

  • The bubble sizes are relative to each group but not both, i.e. The size of a bubble on the destruction side is not relative to the size of a bubble on the production side. This is because, production is much higher so the bubbles would be much smaller on the destruction side
  • The numbers in the bubbles have been scaled down by 1e9 or 1 Billion. 
  • Destruction values is the lost value of all kill-mails in 2013, i.e. it includes not only what was destroyed but also what dropped. On top of that, since supercapitals don't have a market-price, their production cost was added to the killmail value.
  • Production values are end products, not components.
  • System names are truncated in some cases to fit into the respective bubble. To see the exact system names and values, check out the source code of the destruction graph below (read further)
  • No system names below 0.5 are shown in the production part :) 

Now I also generated two different graphs for splitting things up and give greater detail:

Click for high res
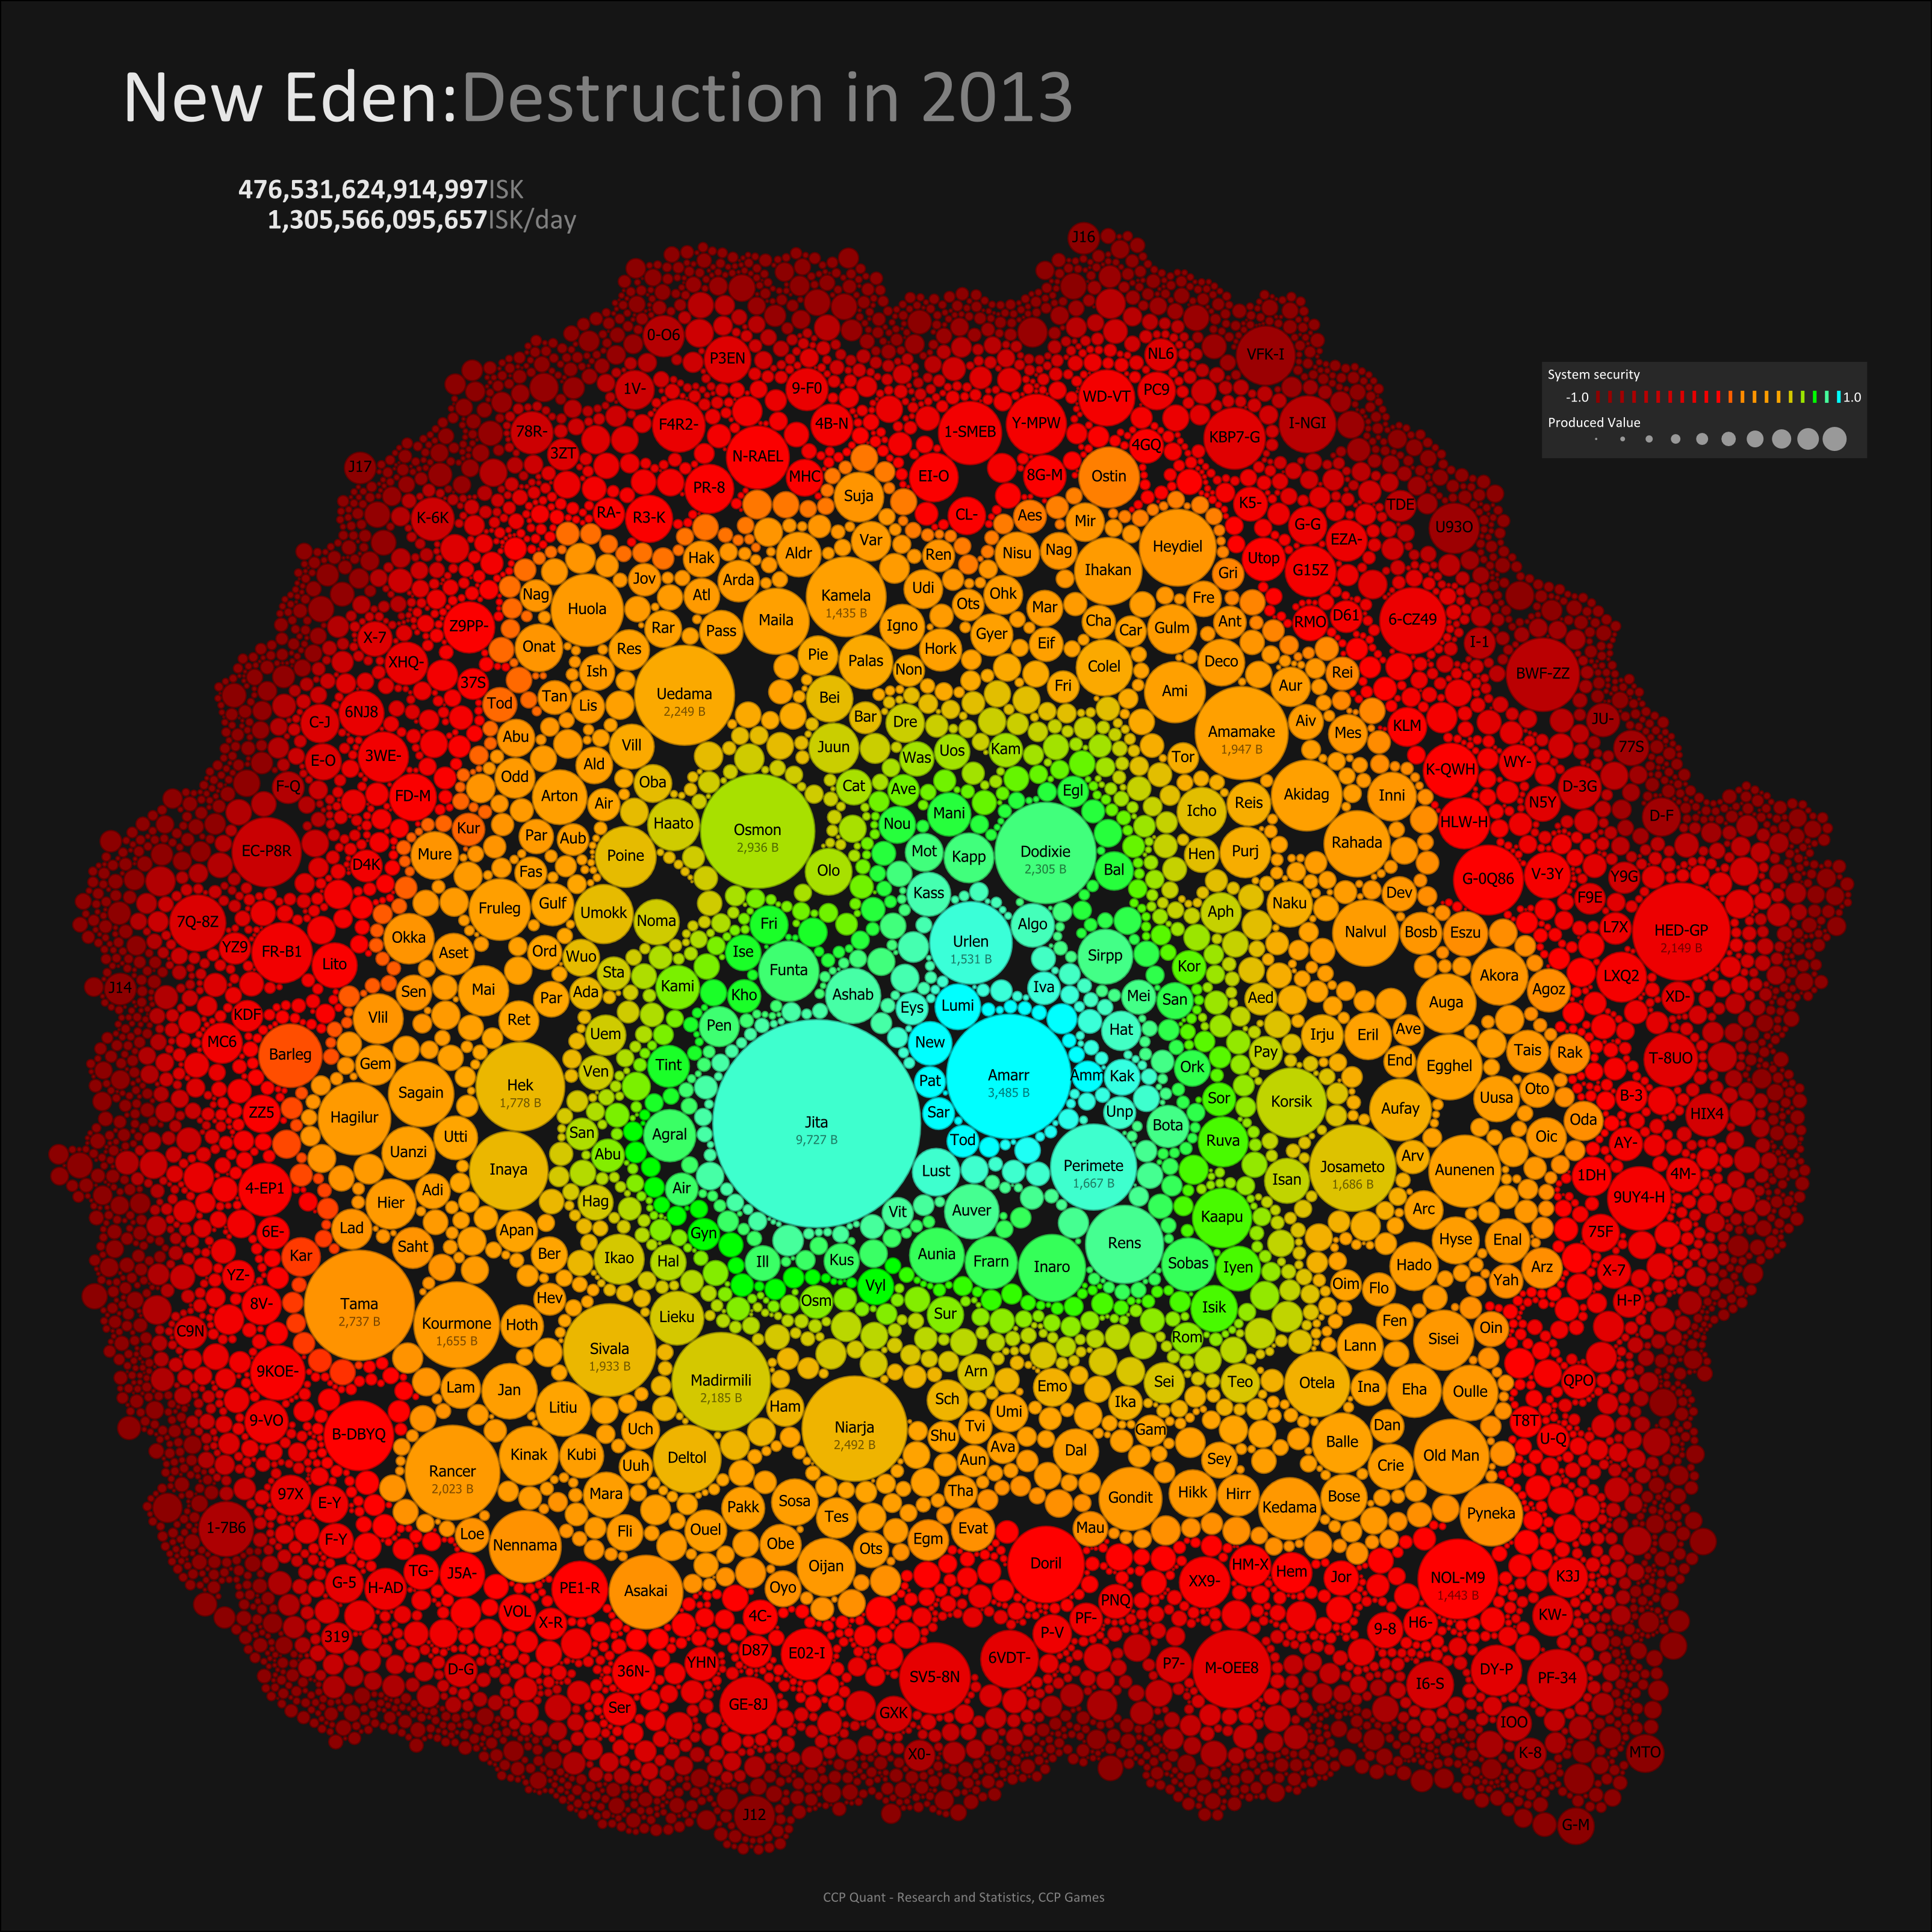
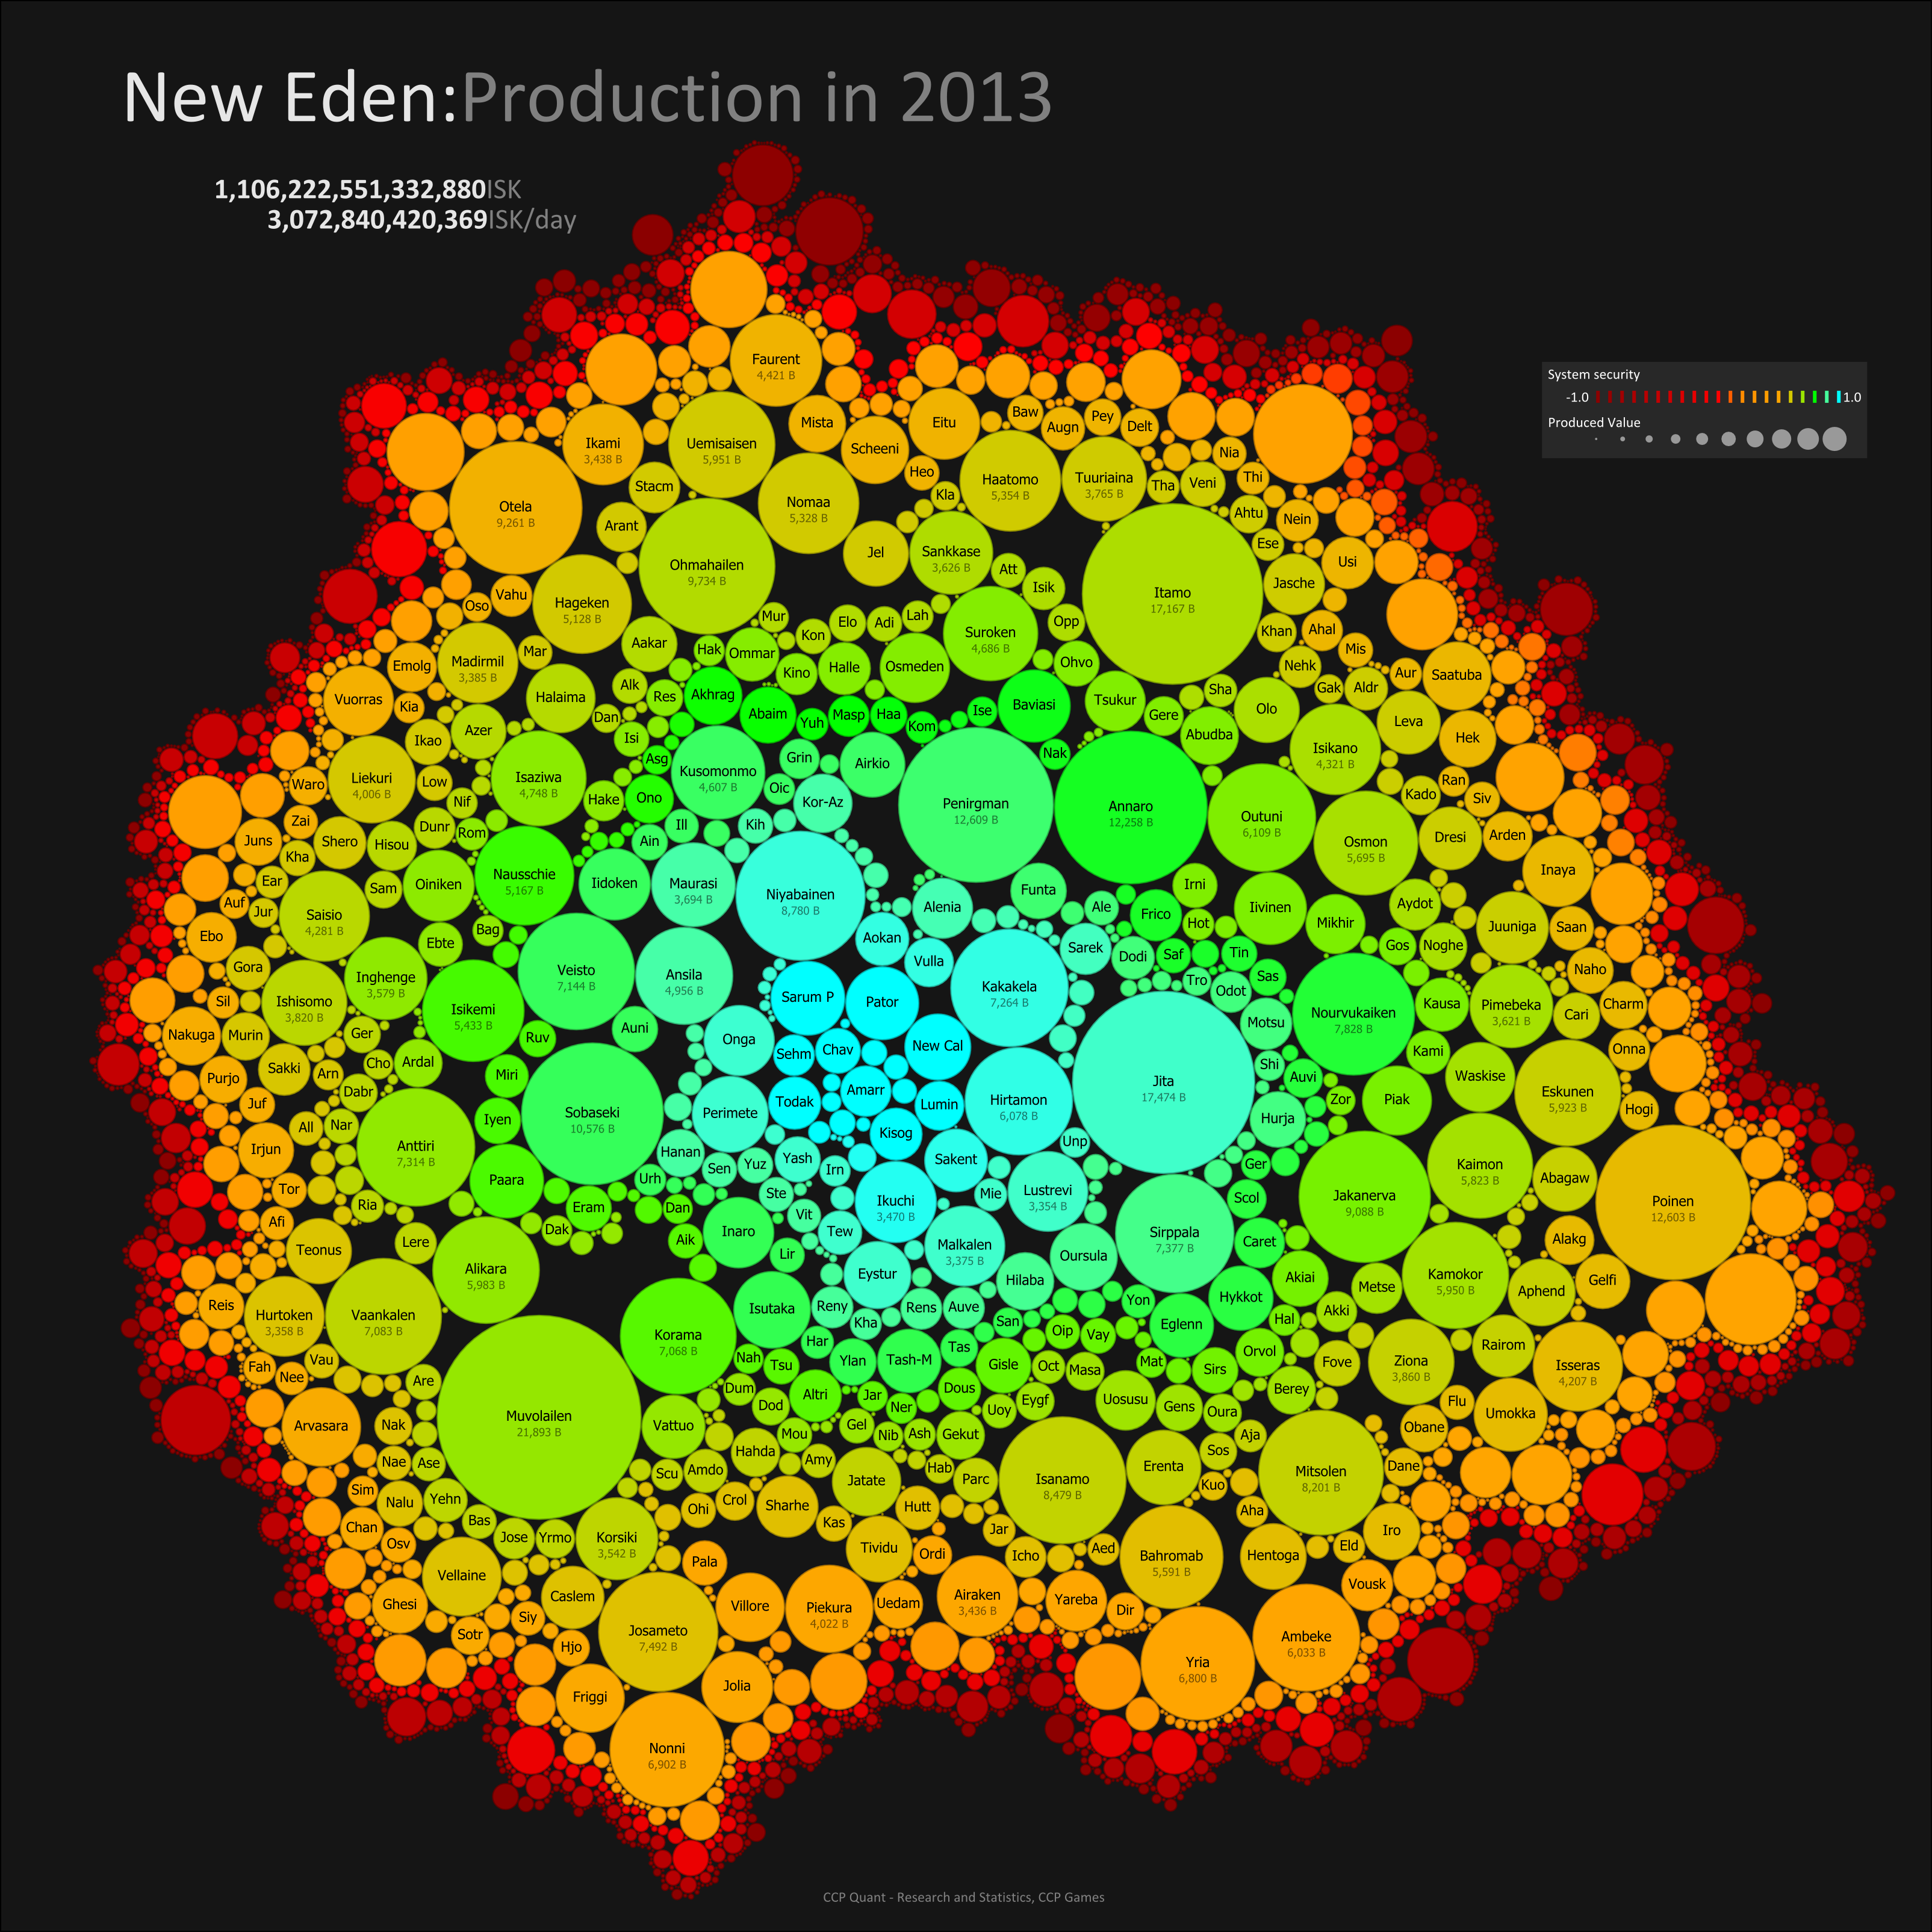
(click images for a larger version)

Last year, one spacebro, while looking at the 2012 graph, said he sometimes hated to be colorblind (redditor zxnmpowq). I did promise you I'd make the code accessible that generates these graphs, so here it is, courtesy of JSFiddle! Code quality was not a priority but I hope it's somewhat readable for those that want to dig into it. Much like our beloved EVE Online, D3.js has a pretty steep learning curve, so be patient with it :). Feel free to make your own versions of this, fork and make different visualizations of it, just be sure to post your results on forums or reddit if you want our attention! For those that don't know how to program, you can at least enjoy the possibility of hovering over each circle to get a tooltip of the underlying system name, its security status and total destruction value in 2013.

You may use this code for non-commercial purposes only, on the condition that the following copyright notice is displayed prominently on any page where the code appears: 

©2014 CCP hf.  EVE Online and the EVE logo are the registered trademarks of CCP hf. All rights are reserved worldwide. All other trademarks are the property of their respective owners. EVE Online, the EVE logo, EVE and all associated logos and designs are the intellectual property of CCP hf. All artwork, screenshots, characters, vehicles, storylines, world facts or other recognizable features of the intellectual property relating to these trademarks are likewise the intellectual property of CCP hf.

As well, when using materials or content that was originally published elsewhere, proper credit must be given to the original author and used only by permission.

The underlying data is included there in the source code but unfortunately you have to suffice with only destruction data for now, production data is very sensitive since not all of it is public knowledge. I.e. we don't want to just flat out give everyone a list of top low- and nullsec-production systems for somewhat obvious reasons.

I still remember a few promises made at the econ lecture at Fanfest 2013, regarding releasing datasets to the community for doing your own analysis. I can tell you that it still is our goal to do so.  Dates are not confirmed yet but Fanfest 2014 is coming soon and we want you guys to have been able to play with the data before then.  So stay tuned for a further blogs on data availablity.

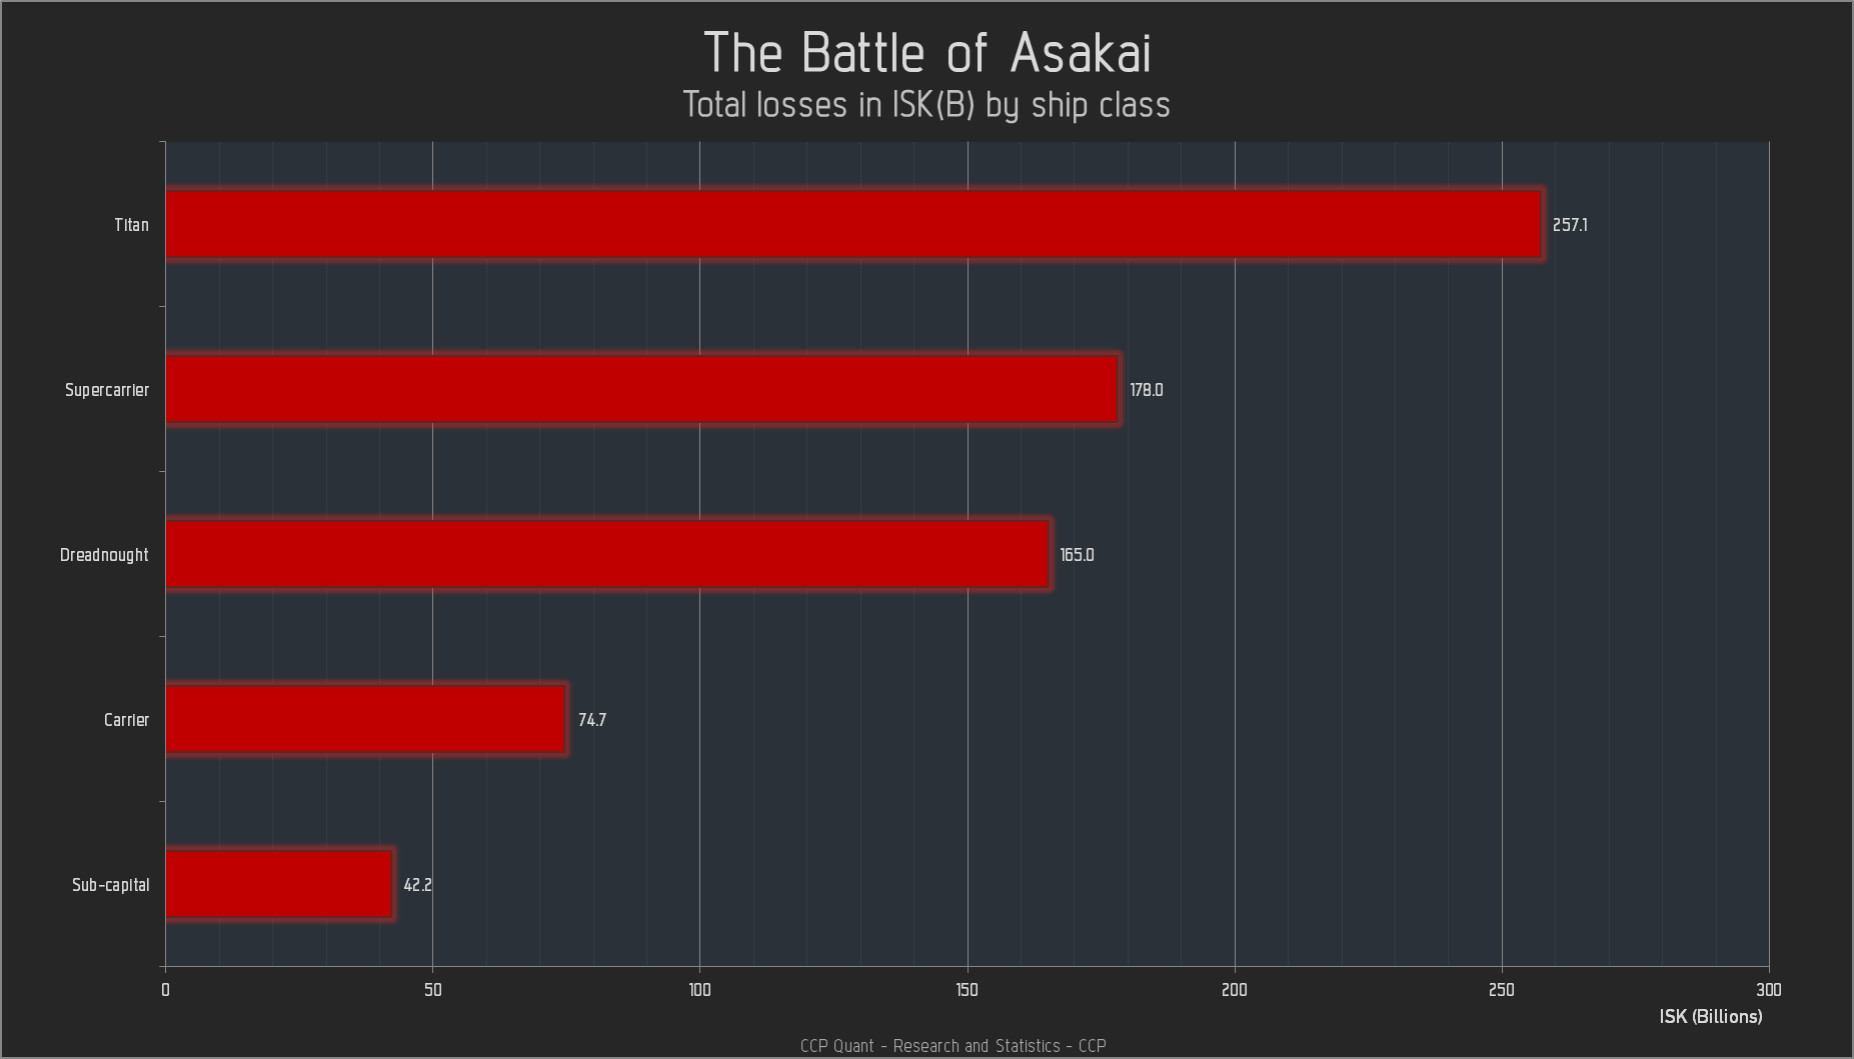
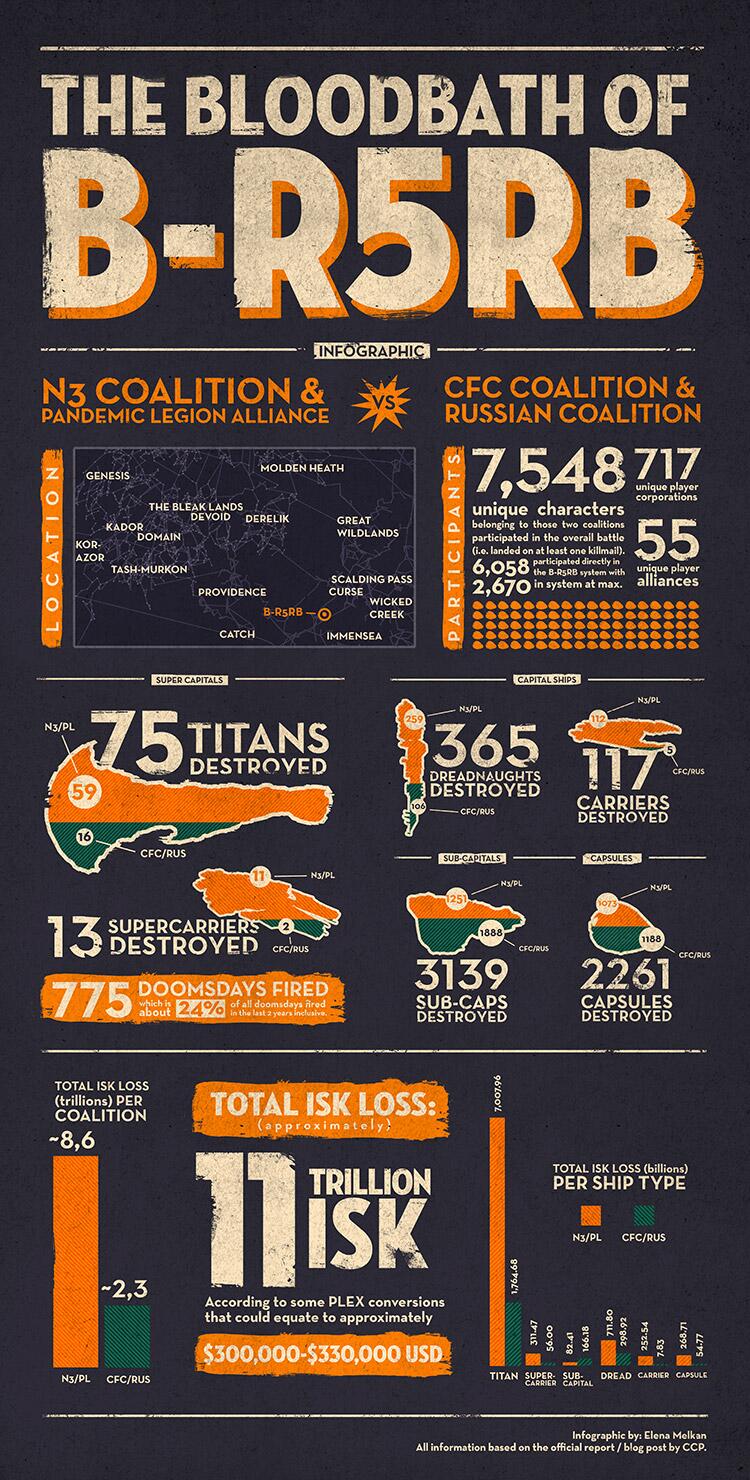
One final honorable mention, is this fancy infograph by Elena Melkan, taking the statistics we released in the form of simple excel graphs and turning it into an eye candy like this! This is a prime example of why it is important for companies like CCP to make data available to their communities!


New to EVE? Start your 14-day free trial today.
Returning pilot? Visit Account Management for the latest offers and promotions.

The Battle of Asakai and Poinen Must Burn by the numbers

Hi I’m CCP Quant

In June 2012 I decided to take a break from banking (Quantitative Research) and joined Dr. Eyjó’s team, Research and Statistics, as a Data Analyst. I’m mainly responsible for predictive modeling, statistical research and general data analysis. 

This past weekend EVE Online saw two major player events, The Battle of Asakai and Red vs. Blue’s: Poinen Must Burn – Mass FFA #3. The sheer scale of these events has really gained the interest of a lot of people, both players and non-players alike. Despite the nature of these events being very different from each other, one planned for weeks, the other not so much at all, both share a ton of explosions and a lot of happy “I was there" moments. 

You can read more about these two events and their context in “A Weekend of Epic Destruction in EVE Online” by CCP Manifest, also published today.

While not really a part of my job description, I couldn’t resist on jumping on this one when requests came pouring in this Monday morning for statistics on these events. After all, who doesn’t love numbers and fancy graphs when it comes to EVE Online?

First, a little data backstory before I go into the juicy details. We here at CCP collect data, lots and lots of data, in the form of event logs. There are about  100GB of logs generated every single day. Until recently, this data had mostly been useful for developers, game designers and GMs.

  • GMs need to puzzle together events for helping to solve petitions and investigating exploits (although sorry, not EVERYTHING is actually logged)
  • Game designers need to make decisions on game balancing issues based on actual numbers and hard facts
  • Programmers need to identify issues with their design and understand what exactly causes some bugs and other unintended game mechanics
  • Producers need to make calculated decisions on what to focus on for the next expansion based on feature usage statistics as well as community feedback

Going through the huge amount of logs had become computationally very intensive. This all changed after it was decided it was time to get us into Apache™ Hadoop®, allowing us to process logs on a scalable computer cluster using map/reduce. We now not only have a Hadoop® cluster processing our logs, but we have our own high level framework built around it, thanks to great development efforts of our inhouse experts.

For those of you who play other online multiplayer games and love the wonderful, detailed player stats pages, Hadoop® is the technology that makes it possible for us to offer similar features for EVE Online. Although I’m definitely not promising any progress on that end any time soon, I can promise you that we’ll have some wonderful time-lapse statistics of New Eden to show you on Fanfest. We’ve already utilized Hadoop® in preparing data for rendering that kind of visualizations for the Museum of Modern Art (MoMA) project, where we captured server data of a specific day in EVE and requested players send us their stories and media of that day to weave together for an installation piece there. You can read more about it here: (Dev blog, announcement).

Now, since all the data is available, all it needs is a little bit of processing, mappin' and reducin', a little bit of cleaning up, and a bit of fancy graphing. Let’s get down to business, starting with the Asakai event.

The Battle of Asakai

We won’t be showing any alliance-, corporation- or character-names. That information is mostly available already on the internet so we’ll focus on ships, modules and destruction. With  717,033,768,274 ISK worth of ships destroyed here is the break-down by ship class:

Total losses in ISK by ship class

Top 25 total losses by ship types

But how many ships were destroyed of each class and group?

Number of lost ships by ship class

Since there were 845 Sub-capital ships lost in this conflict I think it’s only fair to look at what types of ships were destroyed the most:

From all these graphs we can see that 3 Titans were destroyed, along with 7 Supercarriers, 36 Carriers, and 53 Dreadnoughts. Interestingly, a LOT of rookie frigates were destroyed in the process. Since the system had a station, it is likely people docked after losing their ship, grabbed a rookie ship and came back again to get on as many killmails as possible. Some might’ve just wanted to watch the event from the front row.

That’s interesting and all, but this is already available on the kill-boards and nice community-made info-graphs on e.g. Reddit. Let’s look into the value destroyed of each ship class by time:

These graphs tell some of the story now; they show when the super capitals were killed, when the fight actually started and when it ended. But what kind of sorcery lies behind all this destruction? Let’s look at the total effective damage applied by weapon class from 02:00 (2AM) eve time to 07:00(7AM):

This might surprise the average player; Smart Bombs came in second in the total amount of damage caused. In fleet fights, the damage of Smart Bombs, usually used for anti-drone- or firewall- tactics (footnote: firewalling are ships fitted with Smart Bombs that are placed between friends and enemy ships that use missiles, to take out the missiles before they hit their target), is considered negligible compared to the focused fire of all the main weapon platforms. But Smart Bombs are an AOE (area of effect) type of weapon, which means, their damage is applied to every single ship within their range, friend or foe. With this in mind, we can begin to understand how this much damage can be coming from Smart Bombs. Now let’s see the accumulated amount of damage applied from 2:00 to 8:00:

Here we can see how the applied damage accumulates during the entire fight. Fighter bombers really played their role of being capital ship killers, seen here as around 50% of the total effective damage applied. The damage coming from Smart Bombs evenly stacks up throughout the fight and next in line come Energy weapon platforms, Hybrid weapon platforms and so on. Dreadnoughts played a big role there with a lot of Revelation and Moros class dreadnoughts fielded, followed by Phoenix and Naglfar.

Poinen Must Burn - Mass FFA #3

On to the next event, the Poinen Must Burn - Mass FFA 3 by Red Vs. Blue. This great, planned event had the one goal of ensuring the destruction of 28.000 frigates in the solar system Poinen. Everyone was instructed to warp to a POS in Poinen, board a frigate and go warp to the nearest gate or celestial to go down guns blazing killing fellow corp-mates. Despite Red vs. Blue being two corporations at war, they are in fact one corporation split into two teams. The team spirit can be seen by these graphs, note that Red on Red and Blue on Blue kills are identified as Purple Deaths:

The majority of deaths are purple so if the RvB pilots had been favoring killing the other team, the purple number would’ve been lower. 

With just over 350 pilots on each side losing on average 40,19 frigates, each worth 1.107.140M ISK on average, a total of 28.487 frigates were destroyed, totaling 31.500.364.752M ISK!  It’s interesting to look into the details on which types of frigates did the most damage on average, had the most effective hit points and cost the most:

The Incursus can be considered a winner when it comes to average DPS and EHP over cost ratios. The Venture, although a fine new addition to the line frigates, is not the most efficient when it comes to DPS (Damage Per Second) and EHP (Effective Hit Points) over cost ratio. Note that the data collected is restricted to all Frigate kills made in Poinen by Red Federation or Blue Republic within a given timeframe.   The last graph shows how many frigates were destroyed by type:

Lag in Asakai

Now to address the lag in Asakai, here's CCP Masterplan with some relevant details:

Compared to fights in null-sec, we’ve long known that the overhead of the Crimewatch system in low-sec adds a significant amount of load to the server. We have to check the legality of every offensive action (along with all the edge cases for wars, criminals, outlaws and personal flaggings), follow remote-rep chains to penalize assistance, and apply security-status punishments as necessary. None of this is necessary in null-sec. In Retribution we released Crimewatch 2.0. One of the stated goals of this feature was to improve the performance of large fights in empire space. This weekend’s events gave us the first chance to see how the new system would stand up.

For comparison, the last time we saw a fight in low sec that was anywhere near the scale of Asakai was in Uemon in February 2011. During the Uemon fight, we sustained a maximum of 1250 players in local over a period of several hours. This fight was staged on a reinforced server node and consumed all available server resources. It is worth noting that this was before Time Dilation was introduced. Whilst many ships died in Uemon that night, the primary sentiments in the battle reports were of lag and black-screens, rather than people having fun blowing each other up. There were reports of ghost ships that died and then came back after downtime, characters getting completely locked out of the game, and very unresponsive modules.

Whilst we won’t claim that Asakai was completely perfect in performance, we’ve seen much better feedback from those who were there. At its peak, there were 2754 players in local  – more than double the number of Uemon. What’s more, because the spontaneous trigger meant it could not be predicted, the battle was hosted on a regular non-reinforced server node. Even though Time Dilation was pushed to its configured limit of 10%, it still allowed a more graceful degradation than the unpredictable battles of old. We’re pretty sure that without the recent efforts on the software and hardware front, such a fight of this scale would simply not have been possible.

That will be all for now, hopefully, before you wonderful, creative players make more events of this scale happen, we’ll have some tools in place to make automated fight reports. Soon™


-CCP Quant


New to EVE? Start your 14-day free trial today.
Returning pilot? Visit Account Management for the latest offers and promotions.